The environmental footprint of food products is a complex, yet fascinating topic. With such diversity in types of food, production methods, countries of origin, and preparation techniques, the environmental impact can vary significantly between food products – even among products within the same category.
So, what determines the environmental footprint of a food product? Insights from Life Cycle Assessment (LCA) and carbon footprint studies can help answer this in a structured and science-based way. In this article, we walk through the main stages of a product’s life cycle and highlight factors that influence the carbon footprint and broader environmental impact of food products. For each life cycle stage, we also discuss what type of data is required to conduct a life cycle assessment or carbon footprint study.
1. Farm level / Agriculture
The production of crops and animals is in many cases one of the major hotspots in a product’s life cycle. This applies to many impact categories used in life cycle assessments (LCA), such as carbon footprint, water footprint, land use, acidification, eutrophication, and ecotoxicity.
Crop production/cultivation
Key drivers of the environmental impact of crop cultivation include:
- Use of agrochemicals: the application of fertilizers (both organic and mineral) for example, releases nitrous oxide, a very potent greenhouse gas (contributing to climate change), and leads to leaching of nitrate (contributing to eutrophication). If pesticides are used, this is the main hotspot in the ecotoxicity impact category.
- Irrigation: can be a hotspot for the water (scarcity) footprint (or water scarcity footprint) of a food product. Because irrigation can be very energy-intensive, it can also significantly contribute to fossil resources scarcity and climate change impacts of the cultivation stage (especially when powered with fossil fuels). If fields are flooded (especially for rice cultivation), these anaerobic conditions lead to methane emissions.
- Greenhouse cultivation: crops grown in heated greenhouses can have significantly higher emissions compared to open-field alternatives. When you’re from the Netherlands, for example, the carbon footprint of vegetables grown in local heated greenhouses can be higher than the same vegetables imported from the Mediterranean.
- Deforestation: the conversion of natural vegetation to arable land releases large amounts of carbon dioxide, especially if it concerns tropical rainforest. Crops grown on deforested land carry the burden of deforestation, and can therefore have a very high carbon footprint. Examples of crops include soy from Latin America or palm oil.
- Peat: drainage of peatlands also leads to a high release of carbon dioxide as a result of oxidation. Cultivation on peatlands happens in northern Europe, but also in countries like Indonesia.
- Yield: Last but not least, the yield of crops also has a large impact. How is yield related to the environmental impact? The environmental impacts are usually expressed per kg of product. This means that the more you can harvest from a hectare, the lower the impact per kg of product (when assuming the same level of inputs).
Animal products
The environmental footprint of animals is usually higher than crops, not only because the animals consume crops (with environmental burdens as described above) and the conversion of these feed crops into animal products is inefficient, but also because the additional emissions released during animal husbandry.
Key drivers of the environmental impact of animal husbandry include:
- Manure management: leads to the release of methane and nitrous oxide (two potent greenhouse gases), ammonia (contributing to acidification and fine particulate matter formation) as well as runoff of nutrients (leading to eutrophication). Improving manure management practices can lower these types of emissions.
- Enteric fermentation: ruminants (such as cows, sheep and goats) produce methane during digestion. This potent greenhouse gas is a large contributor to the climate change impact of beef and dairy products.
- Feed type: the cultivation of feed crops can have a high impact, especially if it contributes to deforestation (or other factors as described above)
- Productivity: the quantity of output relative to the inputs used (one way to express this is feed conversion ratio) is also of influence on the environmental footprint. This means that extensive systems often lead to a higher footprint (despite benefits in other areas, such as animal welfare)
Data needs
Do you want to calculate the environmental impact of agriculture with a life cycle assessment? During data collection, we gather information on input use (e.g. fertilisers, water, energy), yields, and production practices to accurately model emissions and impacts. In this article you can read more about how we carry out an LCA.
2. Transport & distribution
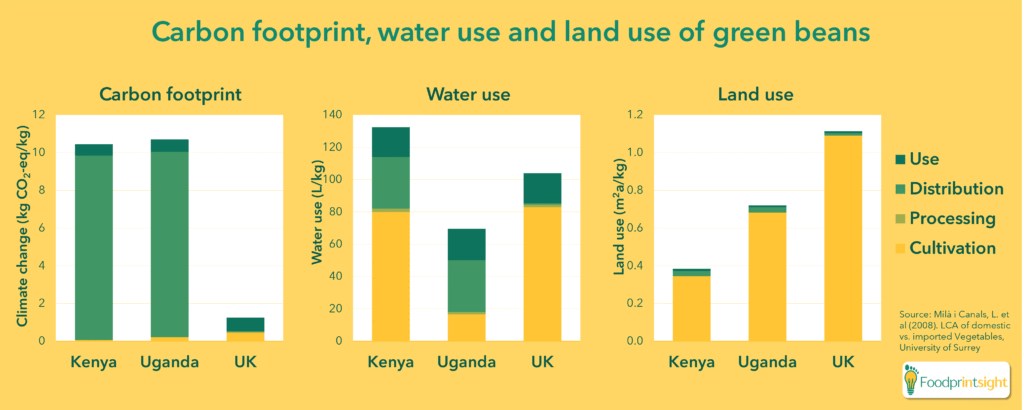
The transport of agricultural products to processing locations and of processed products to the end user is usually just a small contributor to the overall environmental impact of a product. One notable exception is transport by plane (air freight), which has a significantly higher carbon footprint and can be the main hotspot for e.g. beans from Africa. Air transport is especially applied to perishable fresh produce from (sometimes landlocked) countries in Asia, South America and Africa.
Refrigerated transport has a higher impact than ambient transport, because of the higher energy use as well as the use of refrigerants with high global warming potential.
Storage in distribution centres and at retail only contributes minimally to the overall footprint.
Data needs
In order to model distribution in a life cycle assessment or carbon footprint, we ask for data on transport mode, transport distance, vehicle type, refrigeration and empty return. We can use secondary data or defaults for distribution centers or warehouses, or if details on transport are not available.
3. Manufacturing & Processing
The environmental footprint of manufacturing and processing depends on the type of processing involved. Energy-intensive processing techniques, like drying or heating, generally lead to relatively high impacts in climate change and fossil resource use impact categories.
If co-products or by-products are generated during processing (e.g. bran, oil, or pulp), these receive part of the environmental burden through a process called allocation. Allocation can be based on mass, economic value or biophysical characteristics.
Data needs
When carrying out a life cycle assessment, we will ask for data on energy and material inputs, outputs (including coproducts or byproducts), and waste flows in the manufacturing location.
4. Packaging
Even though packaging of food products gets quite some attention, it is rarely a hotspot in a life cycle assessment of food products. Of course there are exceptions, for example packaging can be a hotspot for beverages like soft drinks, that have a relatively small amount of ingredients (diluted in water) compared to packaging material.
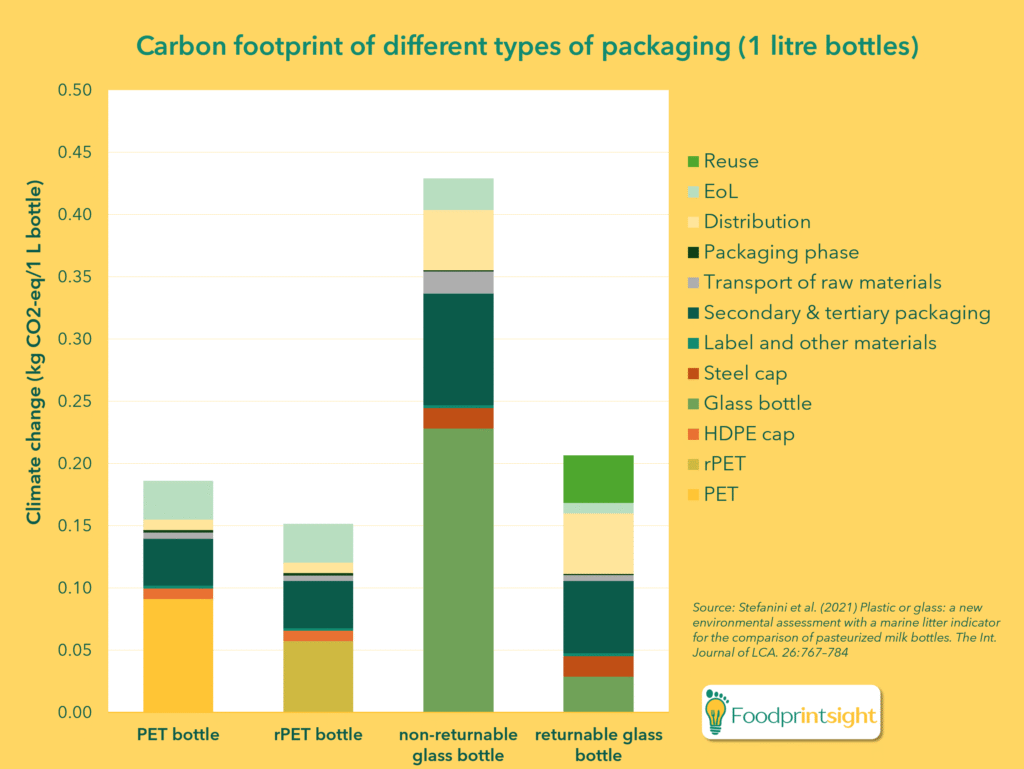
The environmental impact of packaging is determined by the type of material (with heavy materials like glass having a higher impact than plastic or paper), recycled content and the end of life (whether it is reused, recycled, incinerated or goes to landfill).
Data needs
This is also reflected in data collection, where we collect data on packaging type, recycled content and waste treatment (again, defaults can be used).
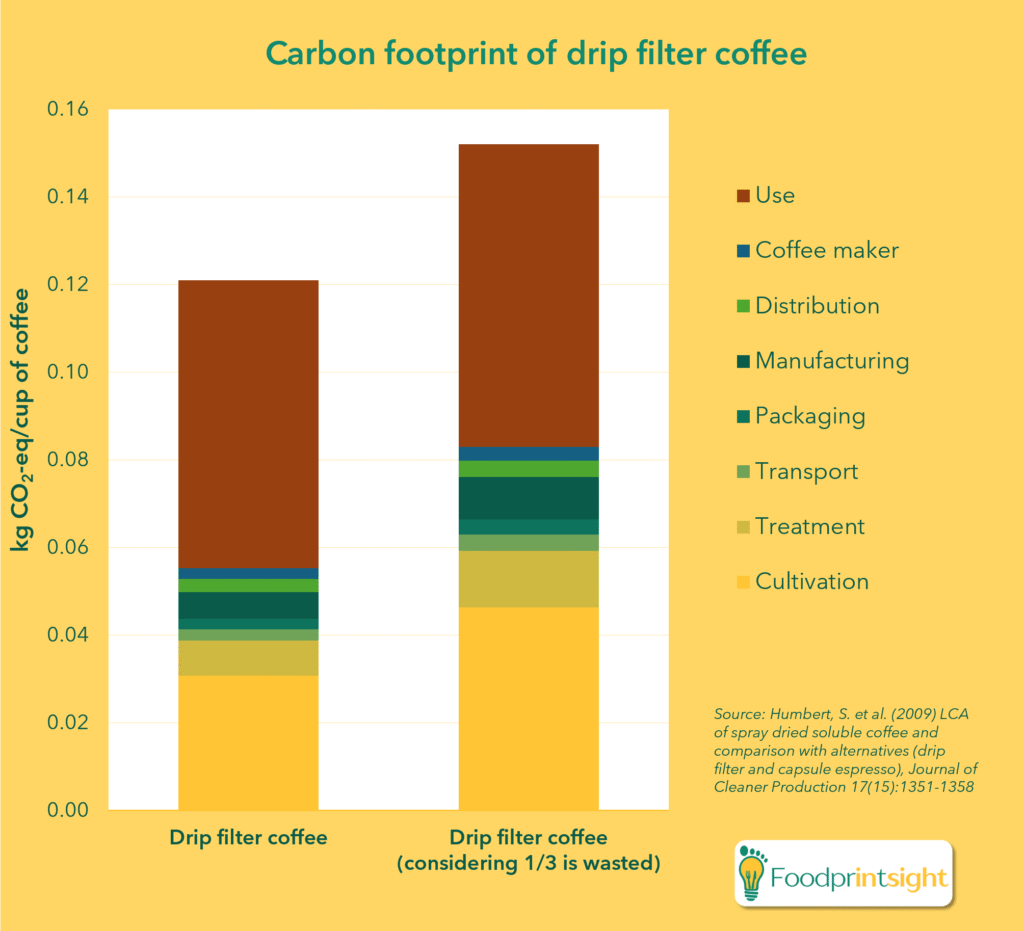
5. Use
The use phase or consumption phase can vary a lot between products. Where some products, like bread or fruit, can be consumed directly, others first need refrigeration and preparation (e.g. a hamburger or veggie burger). In some cases, the use phase can even be the hotspot in a product’s life cycle, for example for a cup of tea, where boiling of water has a significantly higher climate change impact than the tea itself.
Data needs
The use phase can be excluded from a life cycle assessment, e.g. if you’re interested in the environmental impact up to the point of sale. If the use phase is included, usually secondary data and defaults are used, as producers don’t have data on consumer behaviour.
7. Food loss & waste
Last but not least, food waste and losses can have a significant impact on the footprint.
- Food loss typically occurs during production, storage, and processing.
- Food waste usually refers to edible food discarded at retail or by consumers.
Both avoidable and unavoidable losses (e.g. peels, bones) are considered in LCAs. Considering that 30% if food is lost along the food chain, addressing food loss & waste is a key strategy for reducing a product’s environmental burden.
Final thoughts
We have discussed what hotspots can be throughout the different life cycle stages of food products. However, looking at individual stages is not very meaningful without considering the entire life cycle. Only then it becomes visible where the hotspots are. Comparing your product to others helps understand its relative performance.
Note that one should be careful when comparing products to each other: do they take into account the same system boundaries and functional unit, do they use the same methodology (e.g. same type of allocation, same impact assessment method), same data sources etc.?
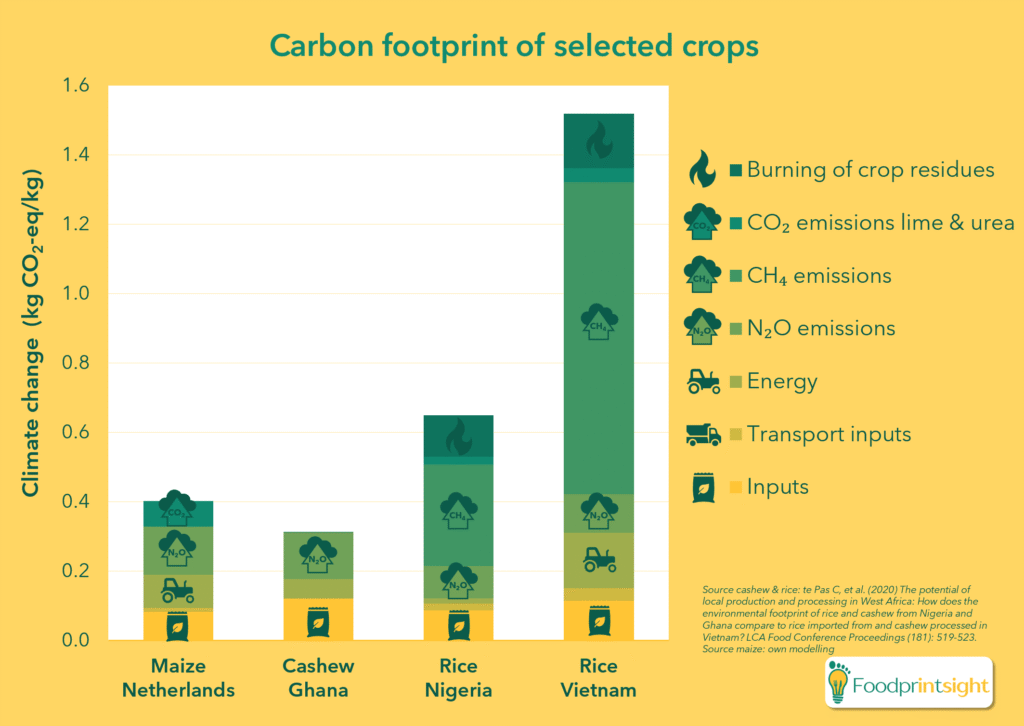
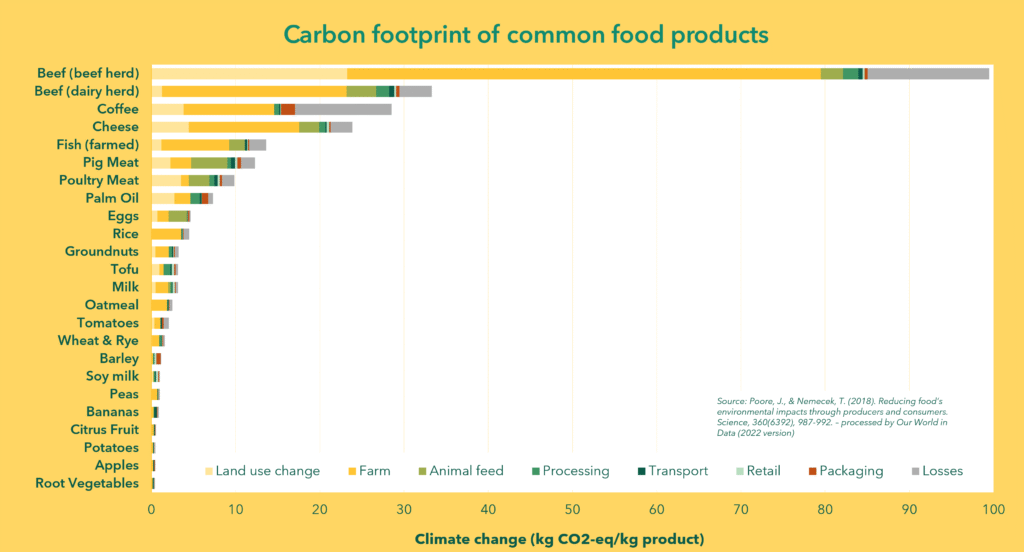
The graph below shows the carbon footprint of some common food products (note that it excludes the use phase!)
As this article shows, environmental hotspots differ depending on the product, production system, system boundaries and environmental impact categories. A full Life Cycle Assessment (LCA) reveals the complete picture—ensuring that no key stage is overlooked and that burden shifting is avoided.
Curious how the environmental footprint of your product looks like, and where you can find hotspots in your value chain? Have a look at our services or contact us!